How do I use the owner's dashboard?
The owner's provides an overview of your portfolio and top-level metrics.

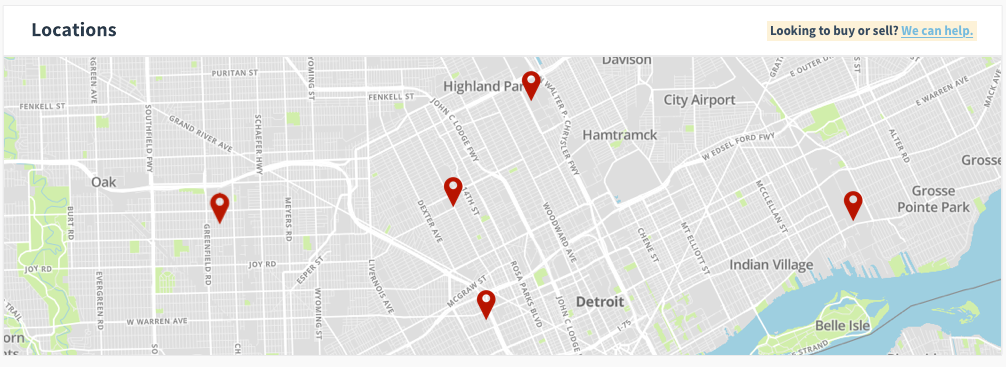
The Locations panel shows a map of all of your properties with Castle. Click the "Looking to buy or sell?" link in the upper right to see properties currently for sale by other Castle customers, or to begin offering one of your own properties for sale.
The Performance panel shows occupancy and rent on time rates, and average monthly income and expenses, for each property and for your portfolio as a whole. (See below for more information on how these metrics are calculated.)
Click the pencil icon in the Purchase Price column to enter purchase prices for a property. When a purchase price is present, the table will calculate average returns on a monthly and annualized basis.
The Income & Expenses panel shows monthly income and expenses. Use the dropdown menus in the upper right to select a timeframe and to choose between viewing data for a specific property or for your portfolio as a whole. The Download button exports your data in CSV format.
The Rent Roll and Ledgers panels show an overview of your tenants' rent payments and your ledger balances with Castle.
The Applicants panel shows an overview of your applicant pipeline for vacant units. Use the dropdown menu in the upper right to select the unit you'd like to see data for.
The Open Maintenance Issues panel shows all open maintenance issues at your properties along with the date each issue was last updated. If an issue requires your approval, the link in the Approval Req. column will take you directly to the relevant issue.
How Dashboard Metrics Are Calculated
- Occupancy rate: The percent of time the property was occupied over the selected timeframe. For multi-unit properties, this is the average occupancy rate for all units. (If a unit has at least one tenant, it is considered occupied.)
- Rent on time: The percent of the month's rent that was paid before the late date, over the selected timeframe. (The late date is the day the late fee is applied. Typically, rent is due on the 1st and late on the 5th.) For multi-unit properties, this is the average rent on time rate for all units.
- Annualized percent: Average monthly net (average monthly income minus average monthly expenses) divided by the property’s purchase price.
- Expenses include maintenance, management fees, and legal fees. Keep in mind that most owners incur some expenses that Castle does not have data about, such as insurance payments and property taxes.
